Usage
Basic
The most common usage pattern, and especially for interactive sessions, is to import the predefined units:
>>> from unit_system import *
>>> Rsense = 10.0*mΩ
>>> Rsense
0.01 Ω
>>> Rsense.to('mΩ')
10.0 mΩ
>>> Is = 10*A
>>> Is*Rsense
0.1 V
Temperature in Celsius has to be entered using:
>>> Ta = Quantity(23, "degC")
since the ‘°’ symbol’s unicode value lies outside the acceptable range for Python variable names.
Temperature differences are expressed in kelvin:
>>> dV = 1*V
>>> dT = 1*K
>>> tempco = dV/dT
>>> tempco
1.0 kg*m**2/(A*K*s**3)
>>> tempco.to('V/K')
1.0 V/K
Arrays can be created:
>>> import numpy as np
>>> f = np.logspace(0, 1, 2)*Hz
>>> f.to("Hz")
[ 1. 10.] Hz
Matplotlib
Matplotlib offers a units interface where a custom class, such as Quantity, can be
registered allowing matplotlib to perform operations as defined by that custom class.
Normally, the default axis labels in matplotlib are set to None, but
in the case of Quantity, the default axis labels are based on the unit. For example:
>>> import matplotlib.pyplot as plt
>>> from unit_system import *
>>> x = [0, 1, 2]*s
>>> y = [4, 5, 6]*m/s
>>> plt.plot(x, y)
>>> plt.show()
It is possible to change the units:
>>> x = [0, 0.01, 0.02]*s
>>> y = [0.04, 0.05, 0.06]*m/s
>>> plt.plot(x, y, xunits="ms", yunits="mm/s")
>>> plt.show()
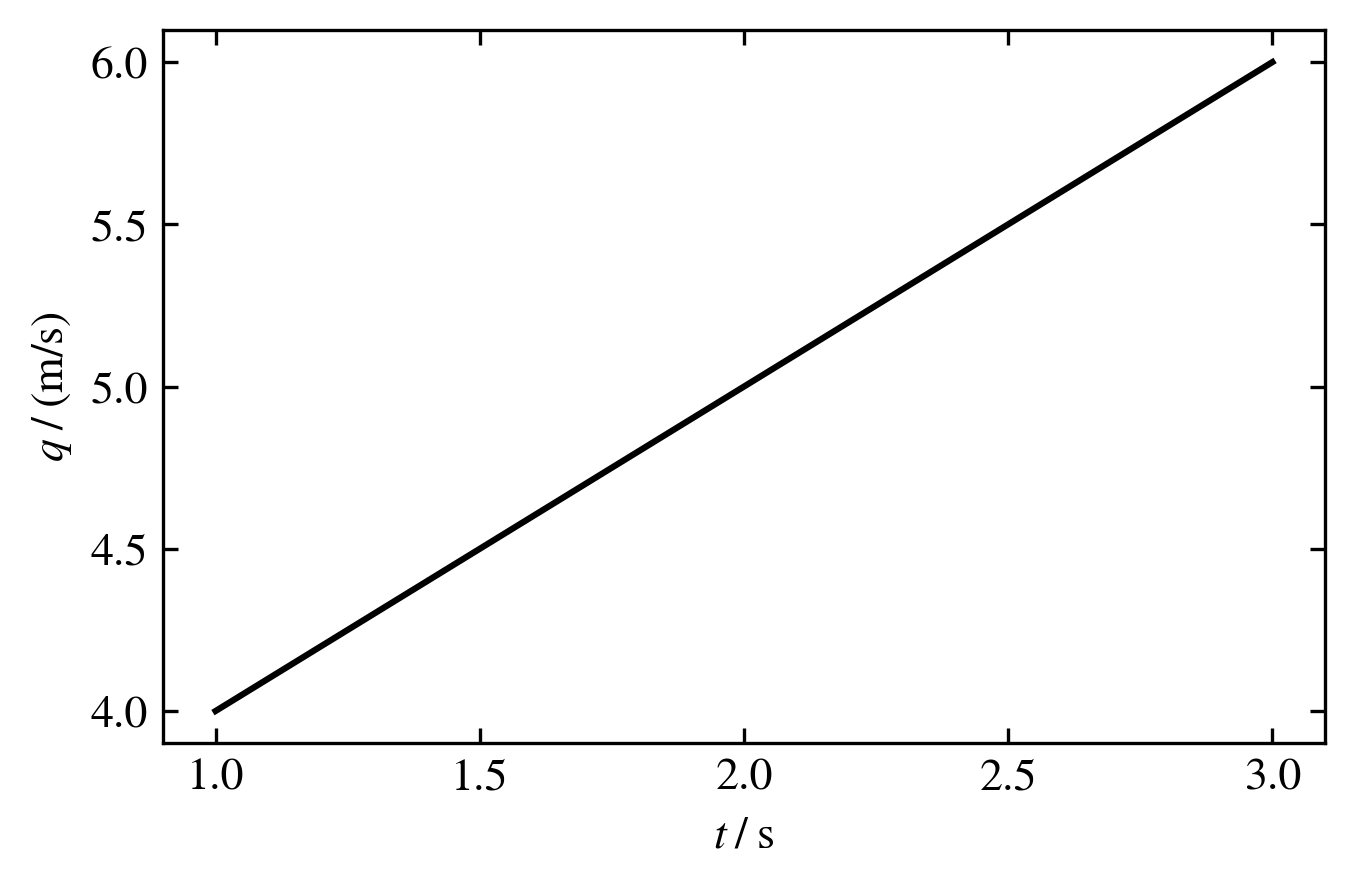
In this graph, the x-axis is labeled ‘t / s’ where ‘t’ is the standard quantity symbol for time and ‘s’ is the unit symbol for the unit seconds. The label is consistent with the BIPM recommendation discussed in the SI Brochure section 5.4.1 where the label is a mathematical expression. A particular number on the axis, such as 2.0, is then read as 2.00 = t / s, or t = 2.0 s. On the y-axis, the q here is just a generic quantity symbol.
Notes
Ω is ALT+234
µ is ALT+230
° is ALT+248
day has unit symbol d that conflicts with candela symbol cd and is not supported