Example
The following example uses data from a publicly available InsightCM server to demonstrate the API. This server presents vibration and related measurements from sensors mounted to physical plant assets at National Instruments in Austin, Texas. Each measurement acquisition is called a data event in InsightCM and can be downloaded as a TDMS file for further analysis. This example uses data from the Cooling Tower Pump which has a MON-10411 tri-axial accelerometer mounted to the AC induction motor driving the pump.
After downloading the TDMS file, start an interactive Python session that supports tab-completion such as from bash. Explore the contents of the file and then plot the vertical axis (MIV) vibration data in the time and frequency domains.
>>> import numpy as np
>>> import matplotlib.pyplot as plt
>>> from nitdms import TdmsFile
>>> tf = TdmsFile("cooling tower pump.tdms")
>>> tf.NI_CM_AssetName
'National Instruments|Austin|Mopac C|Central Plant|Cooling Tower Pump'
>>> asset = tf.NI_CM_AssetName.split("|")[-1]
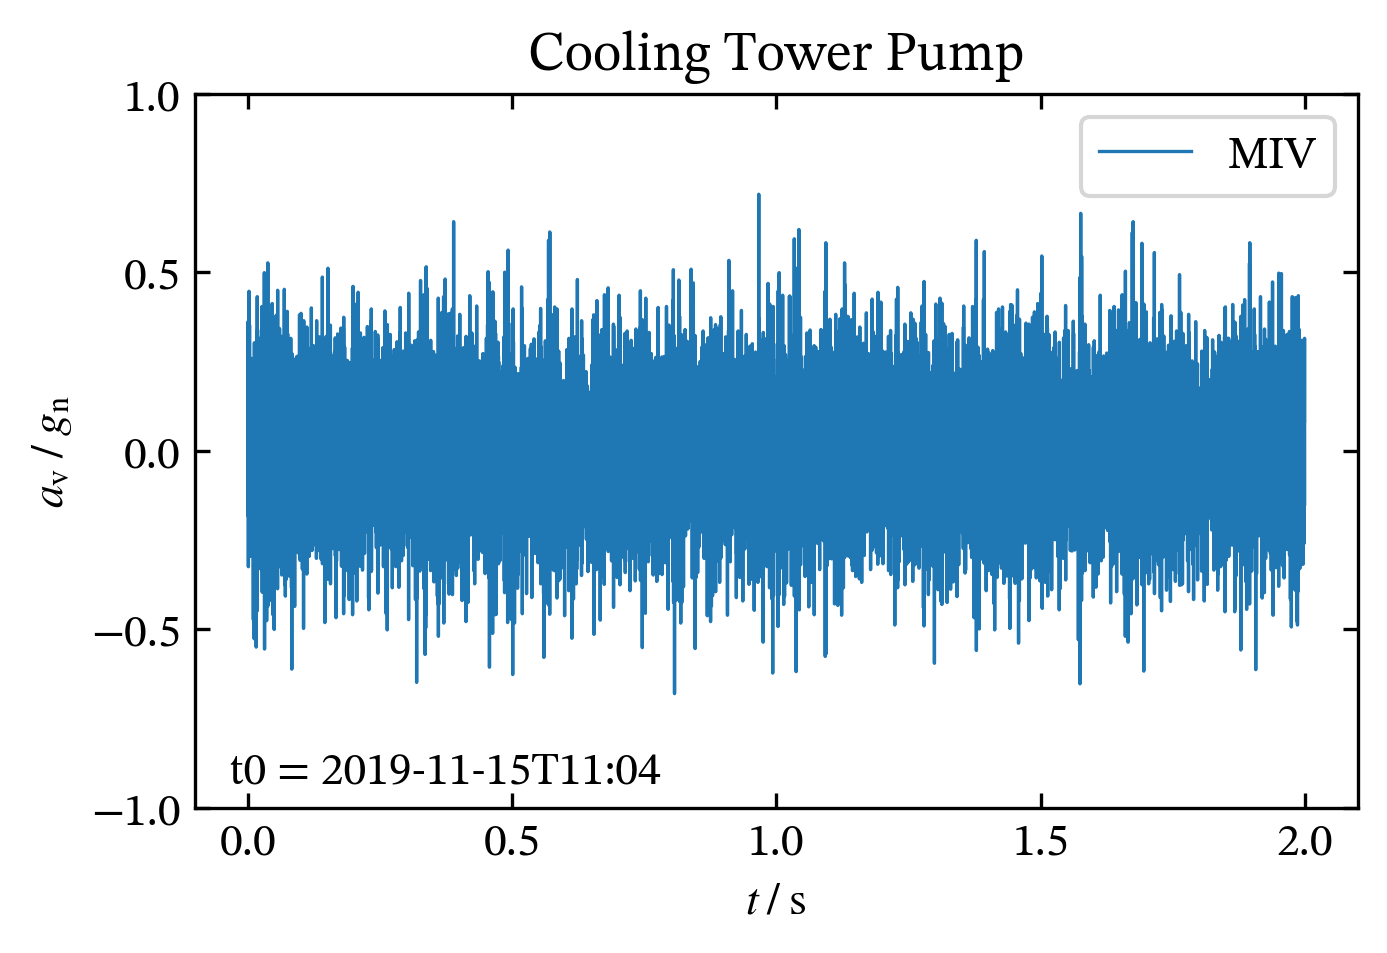
>>> fig, ax = plt.subplots()
>>> ax.set_title(asset)
>>> miv_wf = tf.Waveform.MIV.data
>>> x, y = miv_wf.to_xy()
>>> ax.plot(x, y, linewidth=0.8, label="MIV")
>>> ax.set_ylim(-1, 1)
>>> ax.set_xlabel(r"$t\;/\;{\rm s}$")
>>> ax.set_ylabel(r"$a_{\rm v}\;/\;g_{\rm n}$")
>>> ax.legend()
>>> t0_str = "t0 = " + miv_wf.t0.isoformat(timespec="minutes")
>>> ax.text(-0.035, -0.93, t0_str)
>>> plt.show()
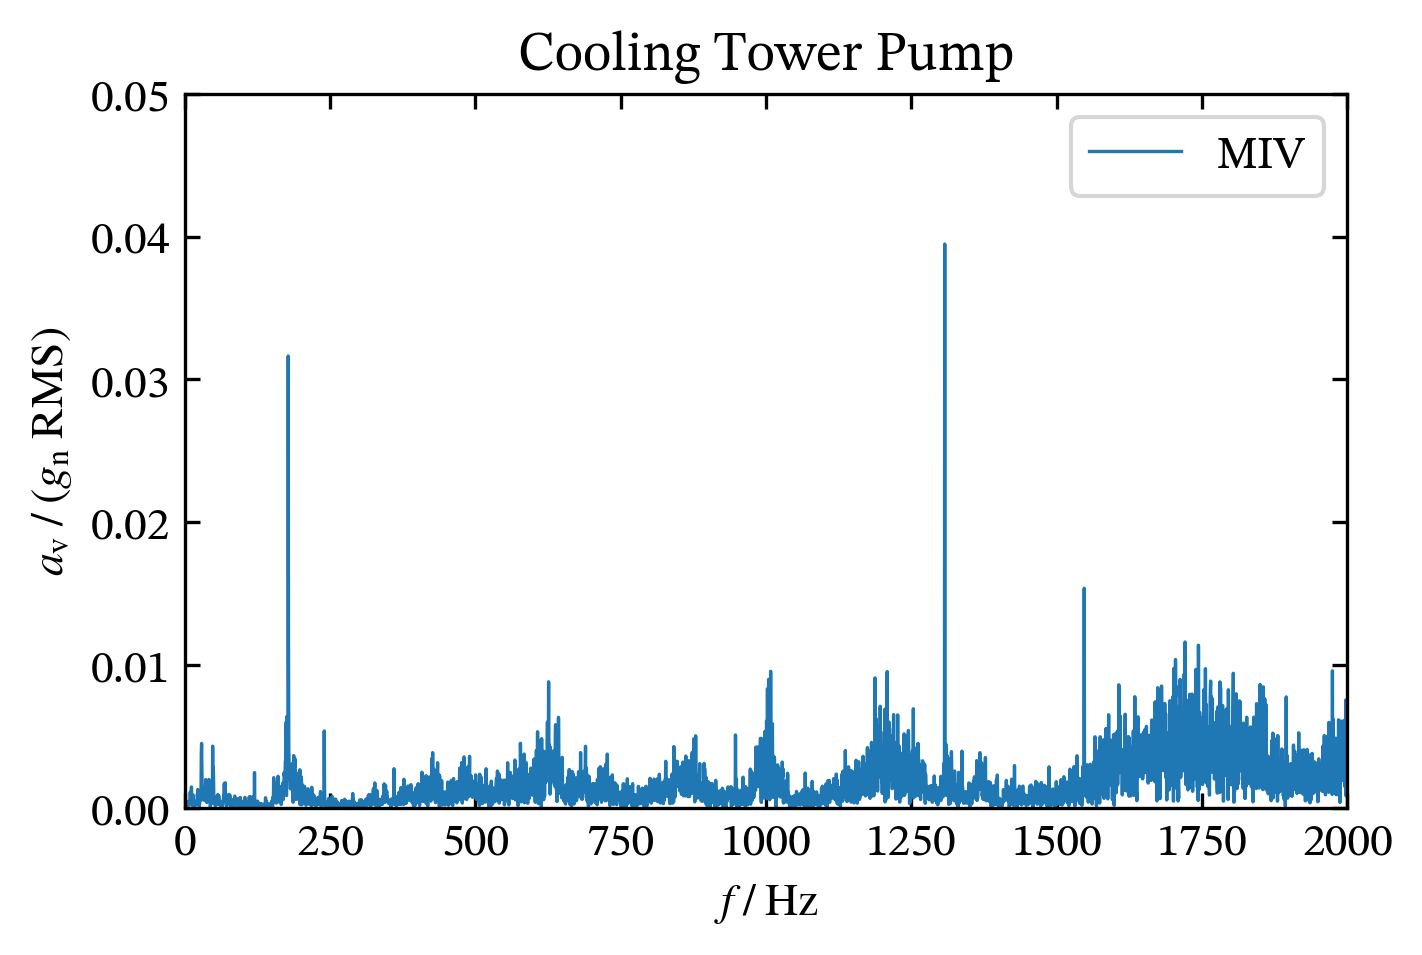
>>> fig, ax = plt.subplots()
>>> ax.set_title(asset)
>>> freq = np.fft.rfftfreq(y.size, miv_wf.dt)
>>> spectrum = np.fft.rfft(y)
>>> mag_spectrum = np.abs(spectrum) / (np.sqrt(2) * spectrum.size)
>>> ax.plot(freq, mag_spectrum, linewidth=0.8, label="MIV")
>>> ax.set_xlim(0, 2000)
>>> ax.set_ylim(0, 0.05)
>>> ax.set_xlabel(r"$f\;/\;{\rm Hz}$")
>>> ax.set_ylabel(r"$a_{\rm v}\;/\;(g_{\rm n}\;{\rm RMS})$")
>>> ax.legend()
>>> plt.show()